Revision: Developing Understanding
Emma Rand

Introduction
Aims
This practical is designed to help you develop real understanding of the way the tests covered work by asking you to consider a research question and determine an appropriate test and generate the data required for particular effects. This will help you meet the overall Data Analysis learning objectives which were that the successful student will be able to:
- Explain the purpose of data analysis
- Name, identify and choose classical univariate statistical tests (and some non-parametric equivalents) appropriate to a given scenario and recognise when these are not suitable
- Use R to perform these analyses on data in a variety of formats
- Interpret, report and graphically present the results of covered tests
Getting started
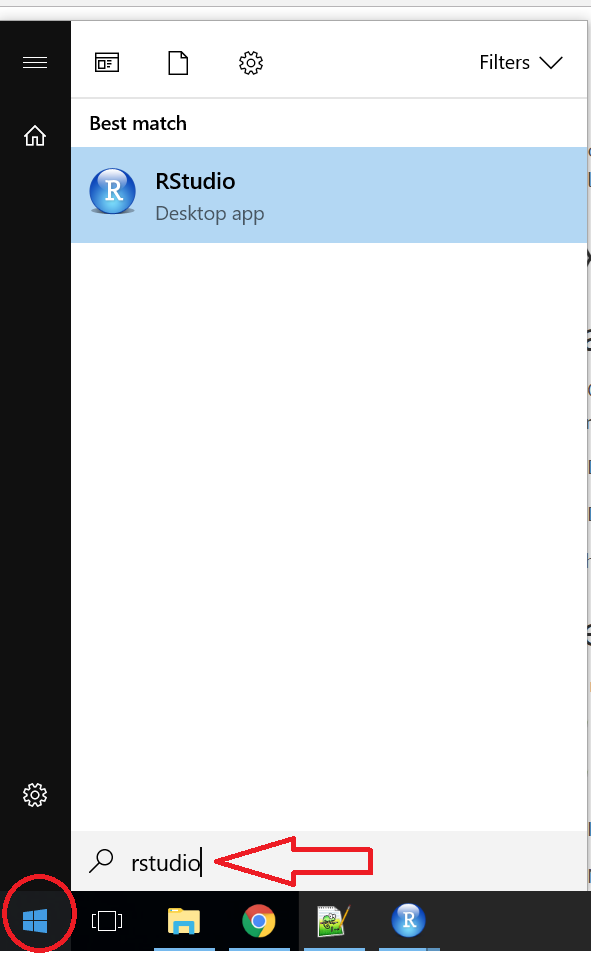
 Start RStudio from the Start menu.
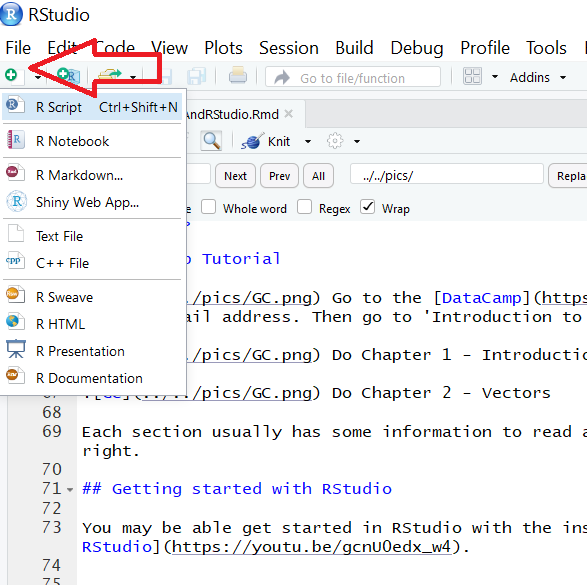
 Make a new project with File | New Project and chose New directory and then New project. Be purposeful about where you create it by using the Browse button. I suggest using your 17C folder. Give the Project (directory) a name, perhaps “revision”
Make a new folder ‘data’ where you will later save data files.
Make a new folder ‘figures’ where you will later save your figures.
Make a new script file called analysis.R or similar to carry out the rest of the work.
You probably want to load the tidyverse with library(tidyverse).
Practical exercises
Instructions
I suggest you work with one or two other people.
For each of the scenarios you need to:
- identify an appropriate design and statistical test for the general research question
- generate the data using the random number functions that would give the effects specified. See the useful commands section below.
- run the test you chose and regenerate the data to get the desired effect if needed
- create figures to accompany the results
Expect to need to discuss your ideas with others, including demonstrators and to have to generate a few datasets before you work out how to get the data which show the requested effects. This is a different way to think but one that is very instructive and will improve your understanding. There plenty of exercises so you may need to continue the practical independently.
Some useful commands
To create a variable x of 10 random numbers with a mean of 15 and a standard deviation of 2:
To round those numbers to 2 decimal places:
To create variable y of 10 random numbers with a mean of 18 and a standard deviation of 2:
To create dataframe with the values of x and y in one column and a grouping variable in another:
To rename dataframe column names:
To create a similar dataframe in a different way:
mean1 <- 15
mean2 <- 18
# make all the values in a group the group mean
measure <- rep (c(mean1, mean2), each = 10)
# then add the random variation
measure <- measure + rnorm(20, 0, 2)
# create the grouping variable
group <- rep(c("x", "y"), each = 10)
# put them in a dataframe
data <- data.frame(measure, group)
To write your dataframe to a file so you can access the data outside of R:
The scenarios
Researchers were interested in the effect of a drug treatment on blood sugar. They had 30 people and gave 15 the drug and 15 a placebo before measuring their blood glucose. What might be an appropriate parametric test? Create a data set on which you can use that test and which indicates the drug decreases blood glucose relative to the placebo. Try to generate data that give a highly significant result and only just significant result. Consider how the data and analysis would differ if they had only 15 people and gave each of them both the drug and the placebo.
Can you manipulate the data (change the values, add data or generate new data) in the the above so that a parametric test is no longer possible? The easiest way to do this is write your dataframe to a file, edit some of the values then read it in again. What might be an appropriate non-parametric test?
Researchers were interested in the effect of location on the size of a particular species of beetle. They measured 8 individuals from each of four locations, alpha, beta, gamma, delta. What might be an appropriate parametric test? Create a data set on which you can use that test and which indicates differences between all populations except alpha and beta.
Researchers were interested in the effect of two treatments, T1 and T2, on neuron length. They wanted to know if each treatment had an effect and if the treatments acted independently. They created four treatment combinations: neither treatment, with T1, with T2 and with both T1 and T2. What might be an appropriate parametric test? Create a data set on which you can use that test and which indicates T1 has a significant effect, T2 does not and the two treatments act independently.
Using the scenario above, create a data set on which that test indicates no apparent effect of each treatment on average, but that the treatments do not act independently.
Researchers wanted to know if the blood glucose response to a drug treatment could be predicted from the dose. They gave doses from 5mg to 50mg in steps of 5mg and and measure blood glucose. What might be an appropriate parametric test? Create a data set on which you can use that test and which indicates a significant positive relationship between dose and response. Try to generate data that give a highly significant result and only just significant result.
Generate the data for a significant negative correlation.
The Rmd file
This is file I use to compile the practical. Rmd stands for R markdown allow R code and ordinary text to be interweaved to produce well-formatted reports including webpages. These contain answers and code even though they do not appear on the webpage itself.
Objectives from previous sessions
Introduction to module and RStudio
- to explain why we need statistical tests and the logic of hypothesis testing (MLO 1)
- use the R command line as a calculator and to assign variables (MLO 3)
- create and use the basic data types in R (MLO 3)
- find their way around the RStudio windows (MLO 3)
- create, use and save a script file to run r commands (MLO 3)
- search and understand manual pages (MLO 3)
Testing, Data types and reading in data
- to able to explain what response and explanatory variables are, distinguish between data types and describe how these impact choice of test (MLO 1 and 2)
- demonstrate the process of hypothesis testing with an example and evaluate potential inferences (MLO 1 and 2)
- read in data in to RStudio, create simple summaries and plots using manual pages where necessary (MLO 3)
- create neat reports in Word which include text and figures (MLO 4)
Goodness of Fit and Contingency chi-squared tests
- recognise when to use chi-squared Goodness of Fit and Contingency tests (MLO 2)
- be able to carry out, interpret and report scientifically both types of test by hand and in R (MLO 3 and 4)
Calculating summary statistics, probabilities and confidence intervals
- Explain the properties of ‘normal distributions’ and their use in statistics (MLO 1 and 2)
- Define, select and calculate with R probabilities, quantiles and confidence intervals (MLO 3 and 4)
- Explain dependent and independent samples (MLO 2)
- Select, appropriately, t-tests and their non-parametric equivalents (MLO 2)
- Apply, interpret and evaluate the legitimacy of the tests in R (MLO 3 and 4)
- Summarise and illustrate with appropriate R figures test results scientifically (MLO 3 and 4)
One-way ANOVA and Kruskal-Wallis
- Explain the rationale behind ANOVA and complete a partially filled ANOVA table (MLO 1 and 2)
- Apply (appropriately), interpret and evaluate the legitimacy of, one-way ANOVA and Kruskal-Wallis including post-hoc tests in R (MLO 2, 3 and 4)
- Summarise and illustrate with appropriate R figures test results scientifically (MLO 3 and 4)
- Explain the rationale behind ANOVA and complete a partially filled ANOVA table (MLO 1 and 4)
- Read in data formatted for other statistical packages (MLO 3)
- Apply (appropriately), interpret and evaluate the legitimacy of, two-way ANOVA in R (MLO 2, 3 and 4)
- Explain the meaning of a significant interaction (MLO 4)
- Summarise and illustrate with appropriate figures test results scientifically (MLO 3 and 4)
- Use RStudio projects (MLO 4)
- Explain the principles of correlation and of regression (MLO 1)
- Apply (appropriately), interpret and evaluate the legitimacy of, both in R (MLO 2, 3 and 4)
- Summarise and illustrate with appropriate R figures test results scientifically (MLO 3 and 4)
